
Analytics setups fail quietly.
A tag can fire and still send the wrong value. A server can return 200 and still leave you unsure whether the event was parsed, enriched, and mapped correctly. A dashboard can look empty simply because the data has not finished processing yet.
That uncertainty slows down onboarding. It also makes advanced tracking setups harder than they need to be.
d8a.tech now includes debug mode for all users, giving teams real-time visibility into incoming tracking requests before they wait for reports.
Why Analytics Debugging Is Hard
Most teams already have a few ways to debug analytics. None of them are useless. None of them are enough on their own.
- Google Tag Manager preview mode is good for checking tags, triggers, and variables, but it does not give full visibility into what happens after the request leaves the browser.
- Browser network tools show the raw request, but they are noisy and require technical confidence. They are not a friendly onboarding tool for most analytics users.
- Server response codes confirm whether the endpoint accepted traffic, but a
200response does not prove the payload was mapped into the right analytics fields. - Dashboards and reports are easy to understand, but processing delays can make debugging confusing. You might be looking at a delay, not a broken setup.
- Log files can help engineers, but they are rarely the right interface for marketers, analysts, or implementation partners.
Server-side tracking makes this even more obvious. You can check whether traffic was sent. You can audit response codes. You can inspect infrastructure logs. But none of that is a convenient way to answer the real question: what did this request become inside the analytics system?
Introducing d8a.tech Debug View
Debug view was built to make analytics onboarding easier.
It is useful for standard users who want to confirm that tracking works, and for power users building custom events, server-to-server integrations, or advanced server-side setups. There is nothing to enable manually: debug mode works out of the box, so you can inspect live events as they arrive instead of waiting for processed dashboard data.
It also works regardless of the tracking protocol or final data destination, which makes it flexible enough for browser tracking, server-side tracking, direct warehouse pipelines, and custom implementations.
Live User Overview
The first view shows currently active users. When multiple people are testing at once, you can quickly locate your own tracking request by searching for the client_id from the first-party cookie. That makes it much easier to isolate your test session.
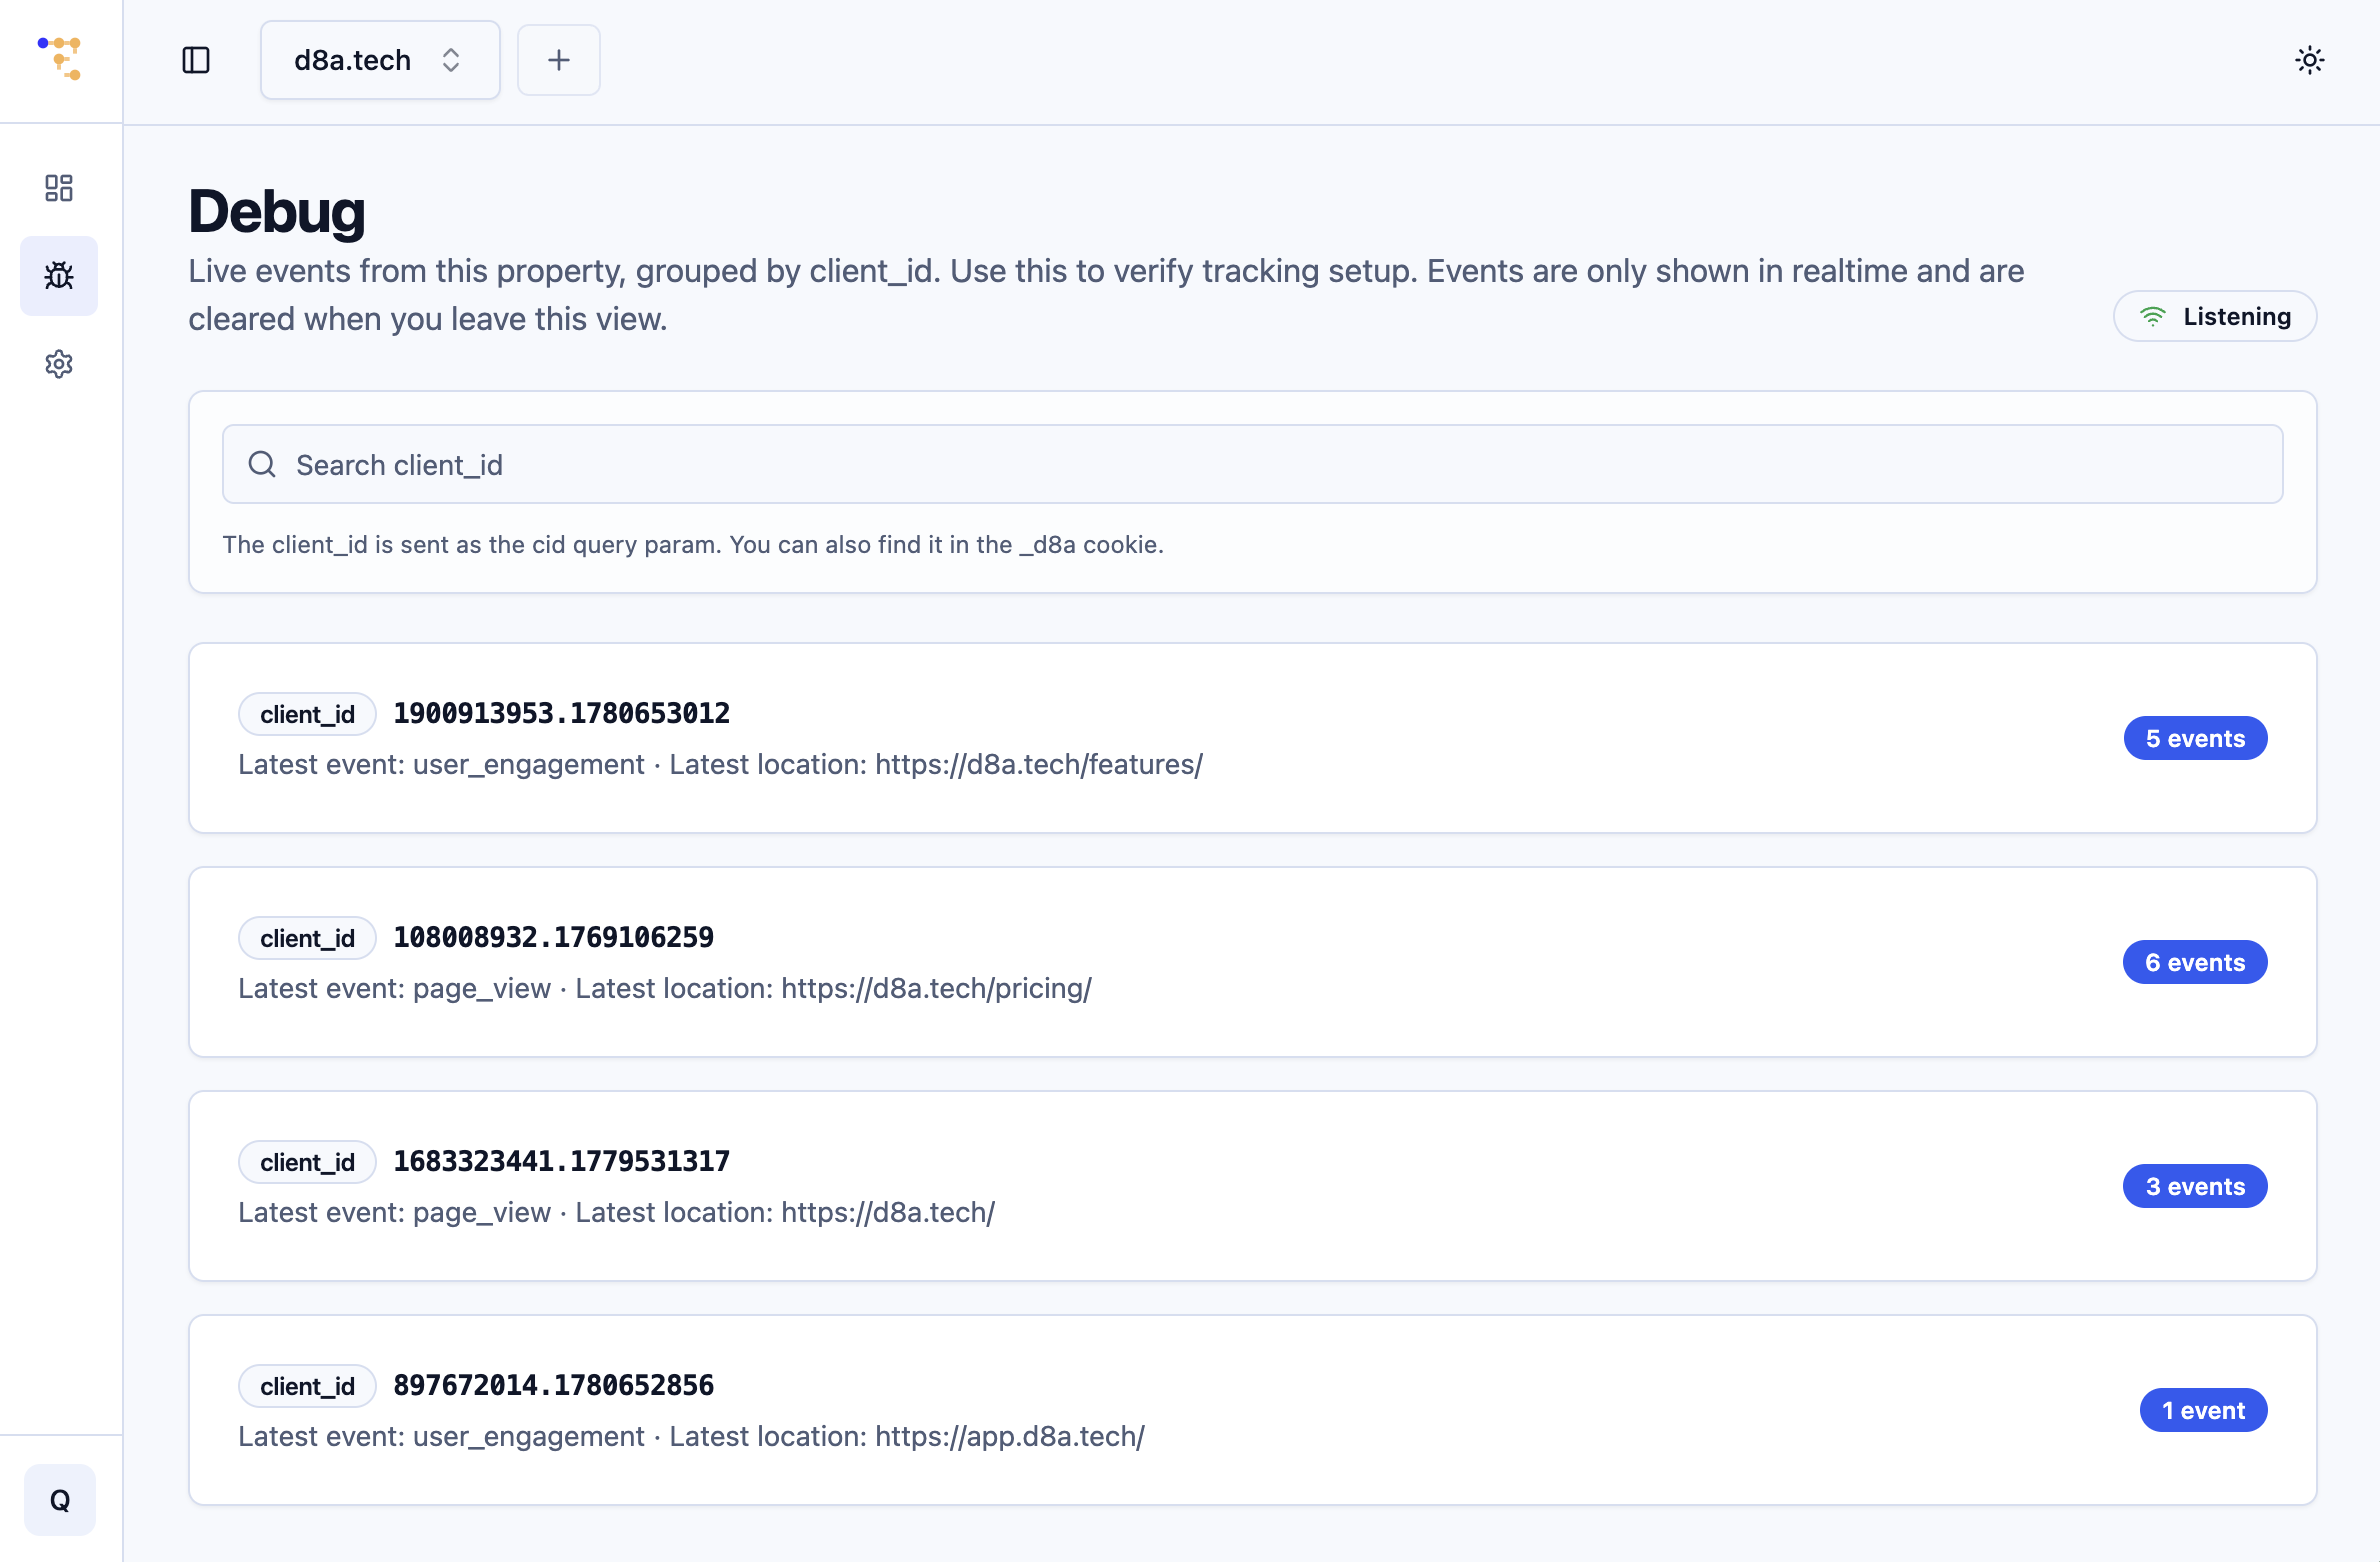
The overview shows active users in real time and lets you search by client_id.
Inspect Raw Events
The event detail view is where debug mode becomes more than a traffic monitor.
For each event, you can inspect the request details that matter for tracking:
- Host
- Timestamp
- IP address, when available and not masked by configuration
- Tracking protocol in use
- Query parameters defined by the protocol, together with raw values
- Tracking-relevant HTTP headers
That already removes a lot of guesswork. You can see what arrived, when it arrived, which protocol was used, and which tracking-relevant values were present on the request.
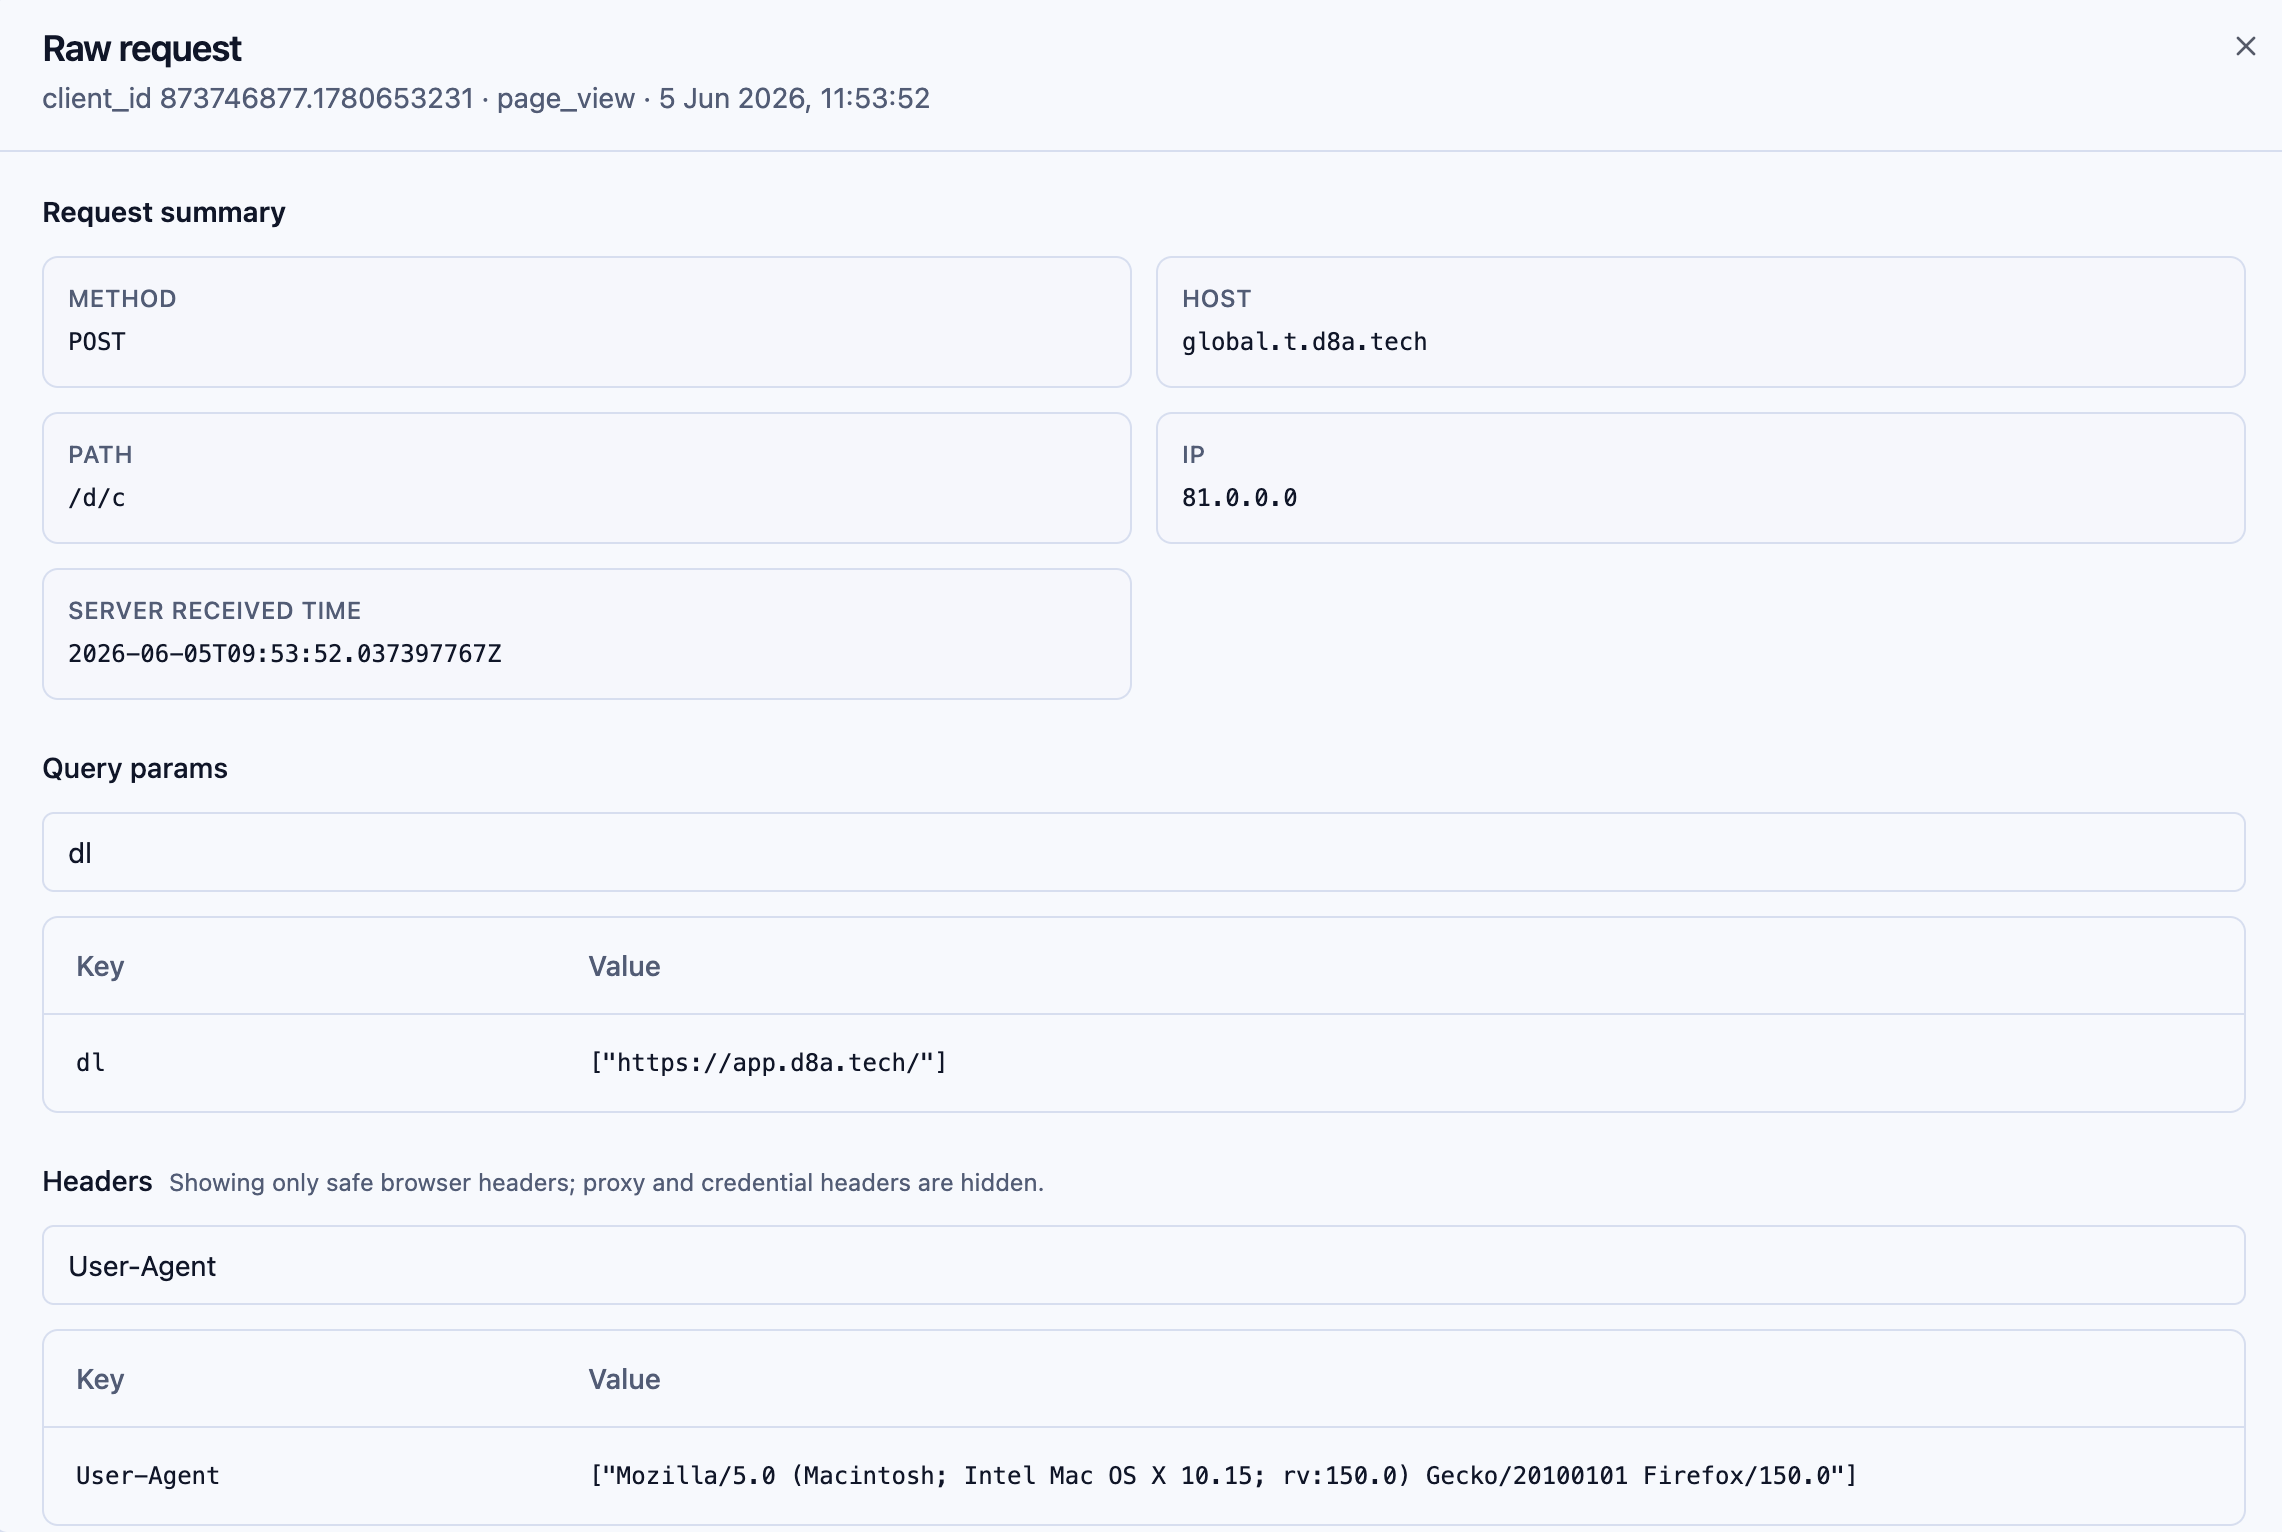
The event inspector screen shows raw event data in detail.
The second part is even more important: you can inspect how the tracking request maps into final event columns in the database. Those are the same fields used by the reporting UI and by BI tools connected to your warehouse.
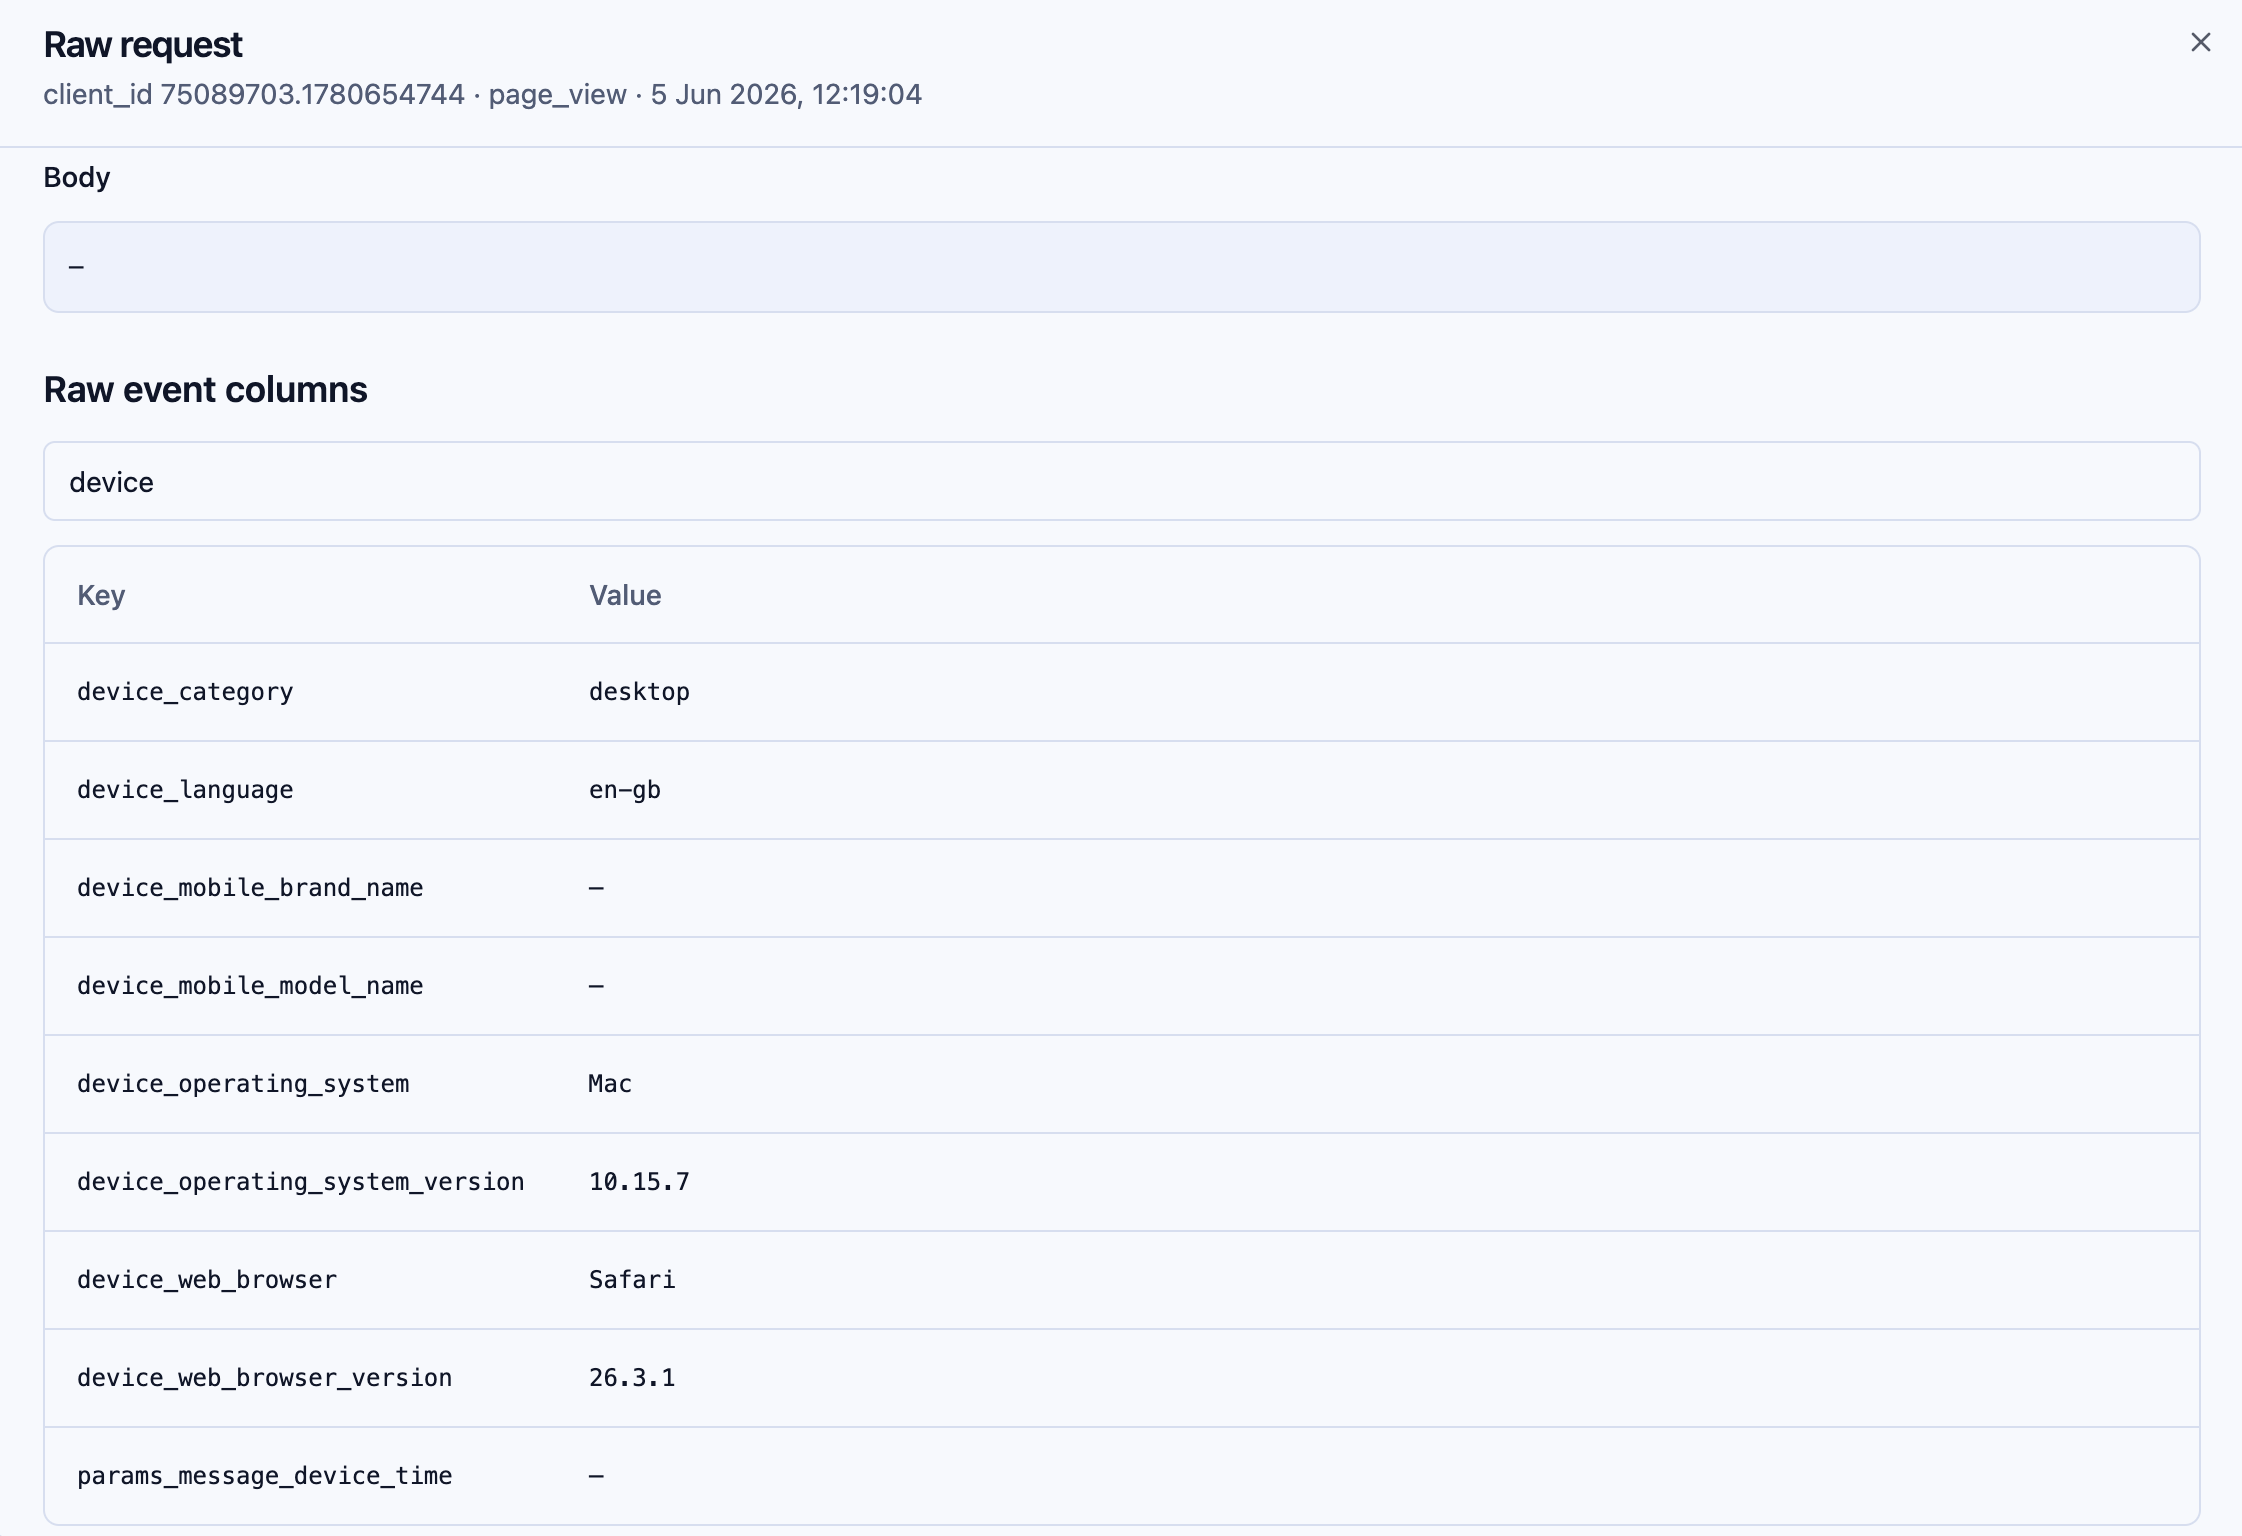
You can inspect which database fields will be populated from the raw tracking request.
A Better Starting Point For Server-To-Server Tracking
Debug mode also helps when there is no browser involved.
The empty state includes an example curl call that sends a test event. For server-to-server implementations, that is a practical starting point: send one request, open debug mode, and inspect exactly how d8a.tech sees it.
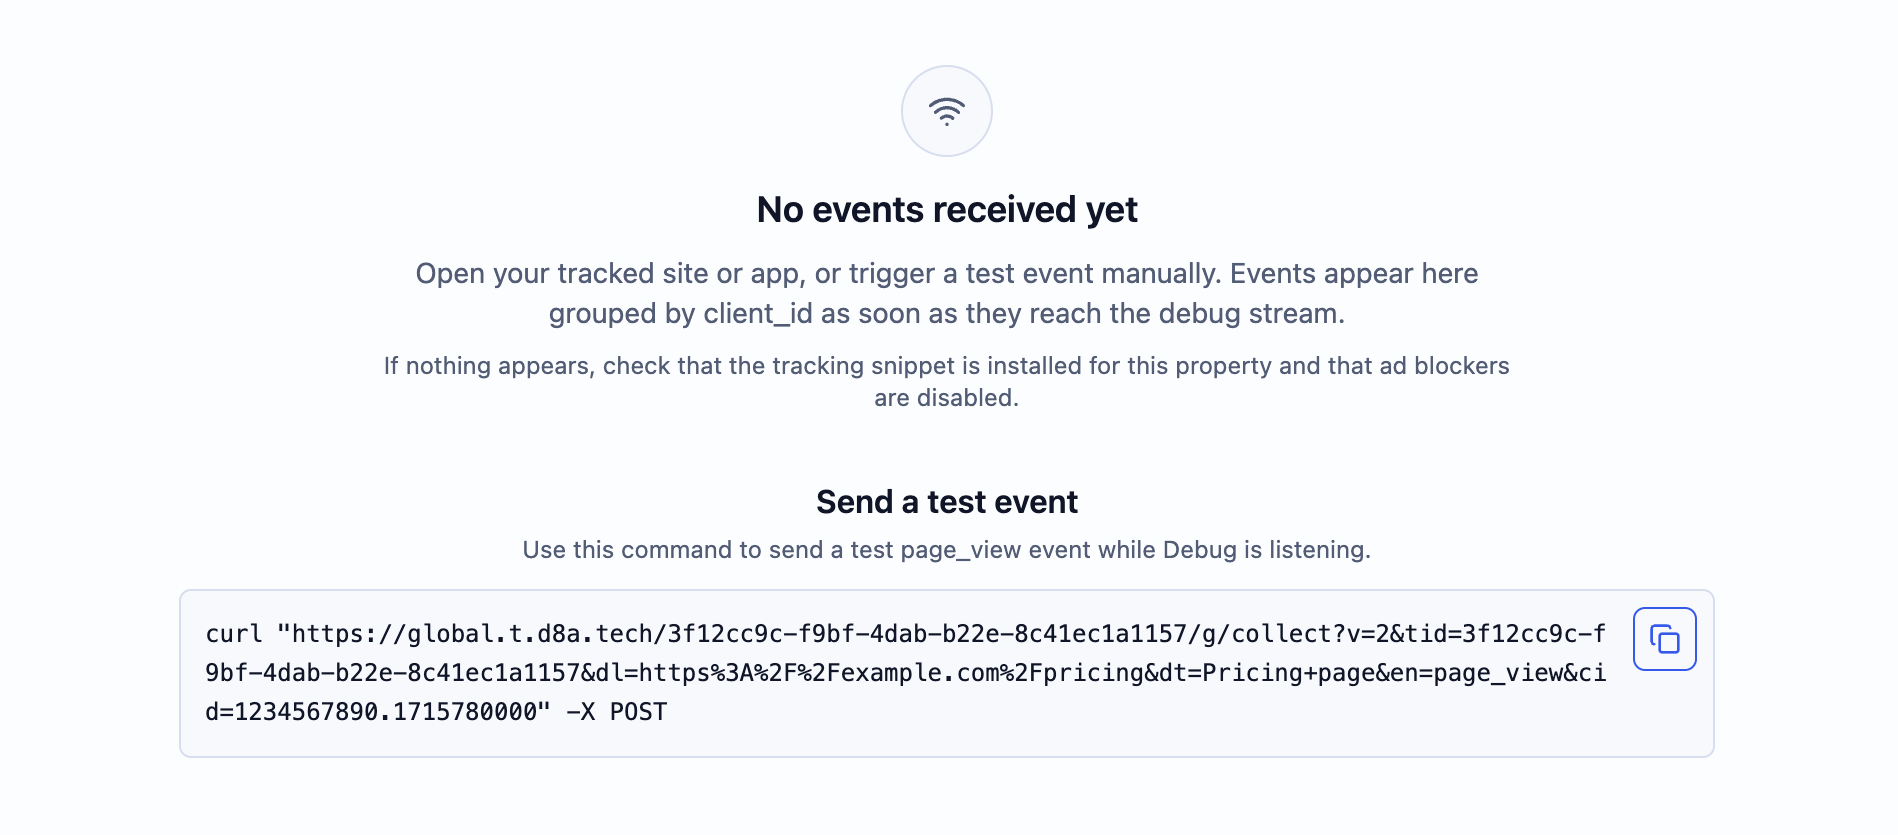
The zero state includes an example curl request, which is useful for server-to-server tracking tests.
Full Visibility For Advanced Setups
Good debugging is not only about catching broken tags. It is about building trust in the full path from request to stored data.
With debug mode, you can see the active user, inspect the raw event, verify relevant headers and query parameters, and check the database columns that will be populated. That gives both implementation teams and business users a shared view of what is happening.
The feature is available now to all d8a.tech users.
If you are onboarding a new website, validating a server-side setup, or testing custom events, open debug mode before waiting for dashboards to catch up.