A complete analytics pipeline - event collection, columnar storage, interactive dashboards - running on your laptop. No vendor invoices, no per-seat pricing, no data leaving your network. Just three open-source tools and a few Docker containers.
This guide walks you through setting up d8a as the collection layer, ClickHouse as the database, and Apache Superset as the visualization frontend. By the end you will have a working stack that ingests tracking events, stores them in a fast columnar engine, and lets you explore them through charts and dashboards.
What You Need
Not much:
- Docker
- A terminal
- About 15 minutes
ClickHouse ships alongside d8a - no separate installation required. Superset runs in its own Docker Compose stack. If you can run docker compose up, you have everything you need.
The Problem
Self-hosted analytics that is actually performant typically means stitching together multiple tools, each with its own deployment model, configuration format, and learning curve. Cloud analytics platforms hide that complexity but charge you for the privilege - and keep your data on their infrastructure under their terms.
The goal here is different: a stack where you own every byte of data, the infrastructure fits in a single command, and the query engine is fast enough to make dashboards feel instant. d8a handles collection and schema normalization. ClickHouse handles storage and fast analytical queries. Superset turns those queries into charts and dashboards. Three tools, one machine, full control.
Step 1 - Install d8a
Follow the getting started guide to install d8a with ClickHouse as the warehouse backend. The installer bundles ClickHouse, so running it gives you both the event collector and the database in one step.
Once d8a is running and configured to store events in ClickHouse, tracking is all about sending an HTTP request. Here is an example using the GA4 web tracking protocol (gtag):
/g/collect?v=2&tid=G-K7M2X9QP4R&dl=https%3A%2F%2Fexample.com%2F&dt=Home%20-%20Welcome%20to%20Example&en=page_view&cid=412053897.1741200134This stores a page_view event for the https://example.com page. For demo purposes, fire multiple page view events using curl so there is enough data to visualize later:
curl "http://localhost:8080/g/collect?v=2&tid=G-K7M2X9QP4R&dl=https%3A%2F%2Fexample.com%2F&dt=Home%20-%20Welcome%20to%20Example&en=page_view&cid=412053897.1741200134" -X POSTVerify the Data
Two ways to confirm events are landing in ClickHouse.
Option A: clickhouse client CLI
clickhouse client --host localhost --port 9000 --password verySecuredD8aDatabase --database d8aThen run a quick select:
SELECT timestamp_utc, page_location, page_title FROM events order by timestamp_utc asc;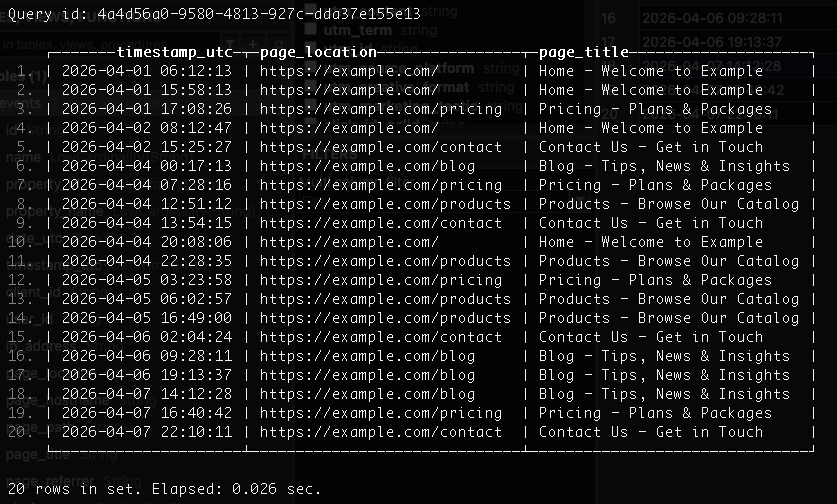
The clickhouse client output shows stored events directly from the events table (click to enlarge).
Option B: DBGate (or any database manager)
Use these connection details:
| Setting | Value |
|---|---|
| Connection type | ClickHouse |
| Database URL | http://localhost:8123 |
| User | default |
| Password | verySecuredD8aDatabase |
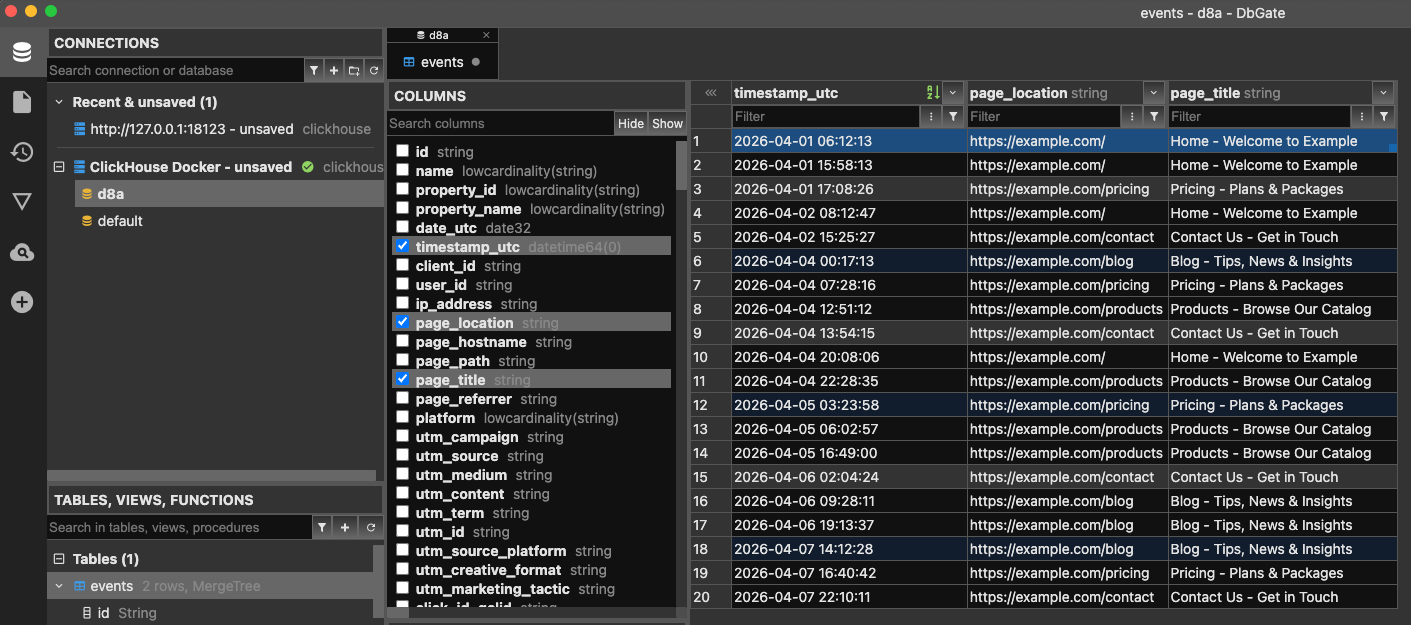
DBGate connected to the local ClickHouse instance (click to enlarge).
Either way, you should see your page_view events with the expected page_location values.
Note:
The curl calls above are just for testing. In a real deployment, events would be triggered by your GA4 installation configured via Google Tag Manager - see the GA4 source guide for setup details. You can also skip Google technology entirely and use the native d8a web tracker, which installs directly on your site with no gtag / GTM dependency.
Step 2 - Install Apache Superset
Superset provides the visualization layer. The official quickstart guide covers the Docker-based setup. The only extra step is adding the ClickHouse driver.
- Clone the Superset repository:
git clone https://github.com/apache/superset.git
cd superset- Create a local requirements file to install the ClickHouse driver inside the Superset containers:
echo "clickhouse-connect>=0.13.0" > ./docker/requirements-local.txt- Start Superset:
docker compose -f docker-compose-image-tag.yml up- Once the containers are healthy, open
http://localhost:8088and log in withadmin/admin.
Note:
For production setups, you would install clickhouse-connect via pip directly on the host machine rather than injecting it through Docker’s local requirements file. The Superset ClickHouse documentation covers driver options in detail.
Step 3 - Connect Superset to ClickHouse
With Superset running, add ClickHouse as a database connection.
- Navigate to Settings > Database Connections > + Database.
- Select ClickHouse Connect (Superset) as the database type.
- Fill in the connection form with these values:
| Field | Value |
|---|---|
| Host | host.docker.internal |
| Port | 8123 |
| Database | d8a |
| Username | default |
| Password | verySecuredD8aDatabase |
The host.docker.internal alias is the key detail here. Superset runs inside Docker, but ClickHouse is exposed on the host machine via port 8123. The alias bridges the container network to the host so Superset can reach the database. The database name is d8a - the same one d8a created during installation.
Test the connection, save it, and you are ready to query.
Step 4 - Build Your First Dashboard
With the database connected, you can start building visualizations.
- Add a dataset. Go to Datasets > + Dataset, select the ClickHouse database, choose the
d8aschema, and pick theeventstable. - Create a Table chart. From the dataset, create a new chart and choose the Table type. Add columns like
page_location,page_title, andtimestamp_utcto get a quick view of recent events. - Create a Line Chart. Create another chart from the same dataset. Choose Line Chart, set
timestamp_utcas the x-axis, useCOUNT(id)as the metric, and usetimestamp_utcas the time filter. This gives you page views over time. - Add both to a dashboard. Create a new dashboard, drag both charts in, and arrange them. You now have a live analytics dashboard backed by your own ClickHouse instance.
Note: You can also add a dashboard-level time range filter from the left side of the dashboard to make both charts easier to explore.
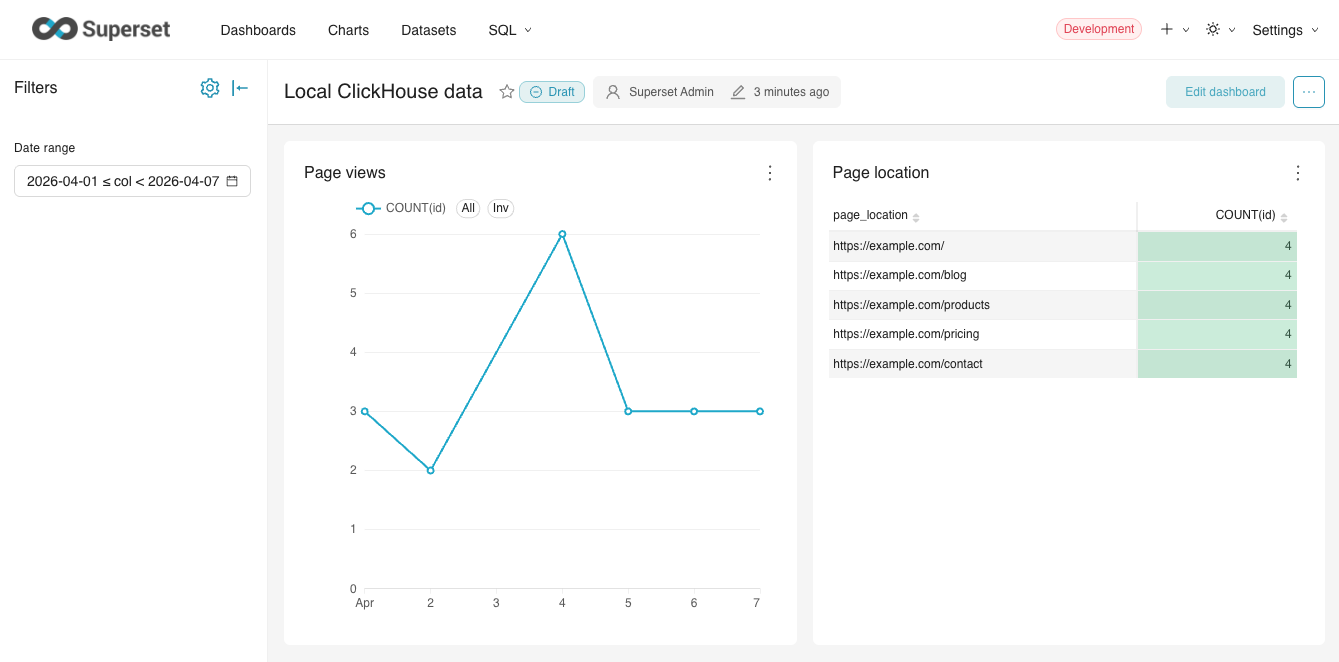
The final Superset dashboard combines a table view with a time-based chart of page views (click to enlarge).
That is the full loop: events flow from the browser through d8a into ClickHouse, and Superset queries ClickHouse to render charts. Everything runs locally, and you own every piece of it.
A Note on Production
This setup is designed for local development and evaluation. For production deployments, each component has its own operational considerations - high availability, backups, authentication, TLS, and more. Start with the dedicated guides:
- d8a: Production Operations
- ClickHouse: ClickHouse Kubernetes Operator
- Superset: Superset Deployment Guide
If you want to explore d8a further, the full documentation is at docs.d8a.tech. The project is open source - contributions, feedback, and questions are welcome on GitHub.